Board Reports: Analytics And Insights For Your Projects
Board Reports give you a comprehensive view of your team's progress, workload distribution, and project health. Whether you need to track sprint velocity, identify bottlenecks, or prepare status updates for stakeholders, Reports provides the data you need to make informed decisions.
#Accessing Reports

To access Reports, click the Reports icon (bar chart) in the board navigation bar. Reports are available to all team members with full board access.
Note: Reports are not available for public boards or users with restricted project access.
#Report Filters And Settings
At the top of the Reports view, you'll find filter controls that let you customize the data displayed across all metrics and charts.
#Date Range
Select the time period for your report data:
| Preset | Description |
|---|---|
| This Week | Monday through Sunday of the current week |
| Last Week | Monday through Sunday of the previous week |
| This Month | First to last day of the current month |
| Last Month | First to last day of the previous month |
| This Quarter | Current calendar quarter (Q1, Q2, Q3, or Q4) |
| Last 90 Days | 90 days from today backwards |
| Custom | Specify your own start and end dates |
#Date Type
Choose how tasks are included in the report:
- Created - Include tasks that were created within the selected period
- Completed - Include tasks that were completed within the selected period
- Active - Include tasks that had any activity within the selected period
#Project Filter
Filter all metrics to specific projects on your board. You can select multiple projects to include, or leave all projects selected to see board-wide analytics.
#Data Grouping
Reports automatically adjust the data granularity based on your selected date range:
- 14 days or less: Data grouped by day
- 15-60 days: Data grouped by week
- More than 60 days: Data grouped by month
#Summary Metrics

Five key metrics appear at the top of your report, providing a quick snapshot of project status.
#Total Tasks
The total count of tasks matching your current filters. This number reflects all tasks within the selected date range and projects, regardless of their status.
#Completed
The number of tasks marked as completed within the selected period. Use this alongside Total Tasks to gauge throughput.
#Completion Rate
The percentage of tasks completed out of the total:
Completion % = (Completed Tasks / Total Tasks) × 100
A higher completion rate indicates strong execution. Compare this across different time periods to track improvement.
#Lead Time
The average number of days from when a task is created to when it's completed. Lead Time measures the total elapsed time a task exists in your system, including any time spent waiting.
Why it matters: Lead Time reflects the customer's perspective - how long they wait from request to delivery. Lower Lead Time means faster turnaround for stakeholders.
#Cycle Time
The average number of days from when work begins on a task (moves to an in-progress status) to when it's completed. Cycle Time measures only the active working time.
Why it matters: Cycle Time reflects your team's actual working efficiency. If Cycle Time is low but Lead Time is high, tasks may be spending too much time in the backlog before work begins.
#Charts And Visualizations
#Burndown / Burnup Chart

This time-series chart helps you track progress toward completing your work scope. Toggle between two views:
Burndown View
- Shows the remaining tasks over time
- A downward trend indicates progress toward zero remaining work
- Ideal for sprint tracking where scope is fixed
Burnup View
- Shows two lines: Completed tasks (solid) and Total Scope (dashed)
- Makes scope changes visible - if the dashed line rises, scope increased
- Useful when requirements evolve during the period
Hover over any data point to see the exact count for that date.
#Status Distribution

A donut chart showing how tasks are distributed across your workflow statuses. The total task count appears in the center.
Each segment represents a status (e.g., Backlog, To Do, In Progress, In Review, QA, Completed), color-coded to match your board's status colors. The legend shows the count and percentage for each status.
What to look for:
- Large percentages in early statuses may indicate a growing backlog
- Tasks piling up in middle statuses (like In Review) may signal bottlenecks
- A healthy distribution shows tasks flowing smoothly through all stages
#Priority Distribution

A horizontal bar chart showing how tasks are distributed across priority levels:
- High - Urgent tasks requiring immediate attention
- Medium - Important tasks with standard priority
- Low - Tasks that can wait
- None - Tasks without an assigned priority
Each bar shows the task count and percentage. The legend at the bottom provides a quick summary.
What to look for: If high-priority tasks aren't being completed proportionally, your team may be spending too much time on lower-priority work.
#Workload By Assignee

A horizontal stacked bar chart showing how work is distributed across team members. Each bar is divided into three segments:
- Done (green) - Completed tasks
- In Progress (blue) - Tasks currently being worked on
- To Do (gray) - Assigned but not yet started
Each row shows the team member's name and avatar, with their completion ratio (e.g., "8/12" means 8 completed out of 12 assigned).
What to look for:
- Uneven distribution may indicate workload imbalance
- Team members with many "To Do" tasks may be overloaded
- Low completion ratios might signal blockers or capacity issues
#Activity Overview

Track all changes happening on your board with two view modes:
Timeline View
A stacked bar chart showing daily activity broken down by type:
- Tasks Created - New tasks added
- Task Changes - Updates to existing tasks
- Tasks Archived - Tasks moved to archive
- Tasks Deleted - Tasks removed from the board
The summary below shows total changes, tasks modified, and active users for the period.
By User View
A horizontal bar chart showing the top 10 most active users, sorted by total changes. Useful for understanding who's driving activity on the board.
What to look for:
- Spikes in activity may correlate with sprint starts or deadlines
- High delete/archive rates near deadlines might indicate scope cuts
- Consistent activity across the period suggests steady progress
#Milestone Progress
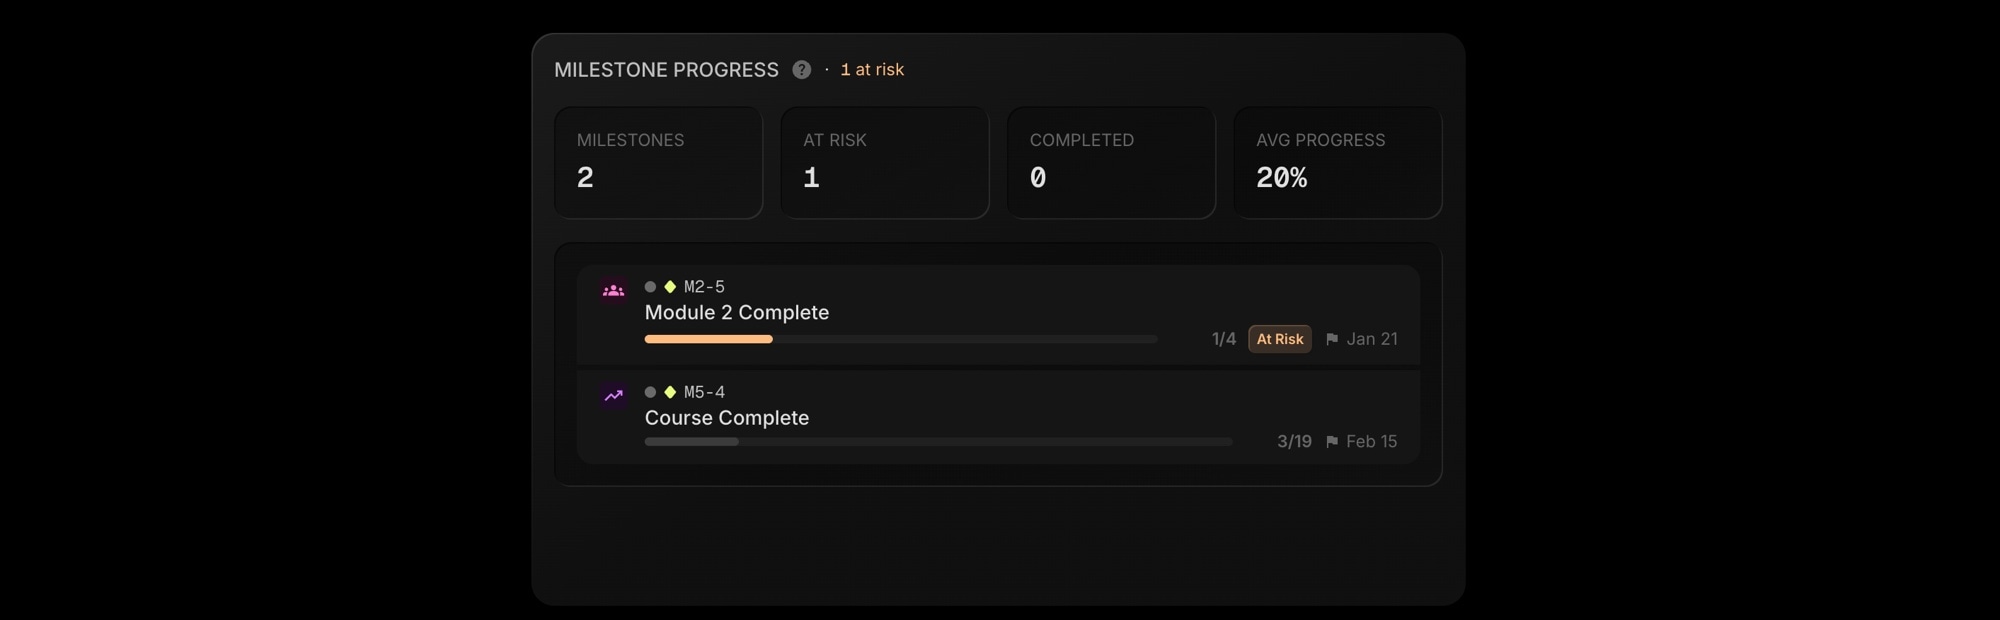
Track progress toward key milestones based on linked task completion. Milestones are tasks with type "milestone" that have other tasks linked to them.
Summary Metrics
| Metric | Description |
|---|---|
| Milestones | Total number of milestones on the board |
| At Risk | Milestones due within 7 days with less than 80% progress |
| Completed | Milestones where all linked tasks are done (100% progress) |
| Avg Progress | Average completion percentage across all milestones |
Milestone List
Each milestone shows:
- Project identifier and milestone title
- Progress bar with completion ratio (e.g., "3/10" means 3 of 10 linked tasks complete)
- Due date with flag icon
- "At Risk" badge for milestones due soon with low progress
- "Complete" badge when all linked tasks are done
Click any milestone to navigate directly to it in the board.
What to look for:
- At-risk milestones need immediate attention to meet deadlines
- Low average progress across milestones may indicate planning issues
- Milestones without linked tasks will show 0% progress - consider linking relevant tasks
#Dependency Health

For boards using task dependencies, this section provides insights into dependency complexity and potential risks.
Summary Metrics
| Metric | Description |
|---|---|
| Dependencies | Total number of dependency relationships |
| Tasks with Deps | Count of tasks that have at least one dependency |
| Avg Chain | Average length of dependency chains (higher = more complex) |
| Max Chain | Longest dependency chain on the board |
Blocking Tasks
Lists tasks that are blocking other tasks from starting. Each task shows:
- Project identifier and task title
- "Blocks N" badge indicating how many tasks it's blocking
- "Overdue" badge if the task is past its due date
At-Risk Tasks
Lists tasks that are currently blocked by dependencies. These tasks cannot progress until their blockers are resolved.
Click any task to navigate directly to it in the board.
What to look for:
- Long dependency chains (high Max Chain) create fragile workflows
- Overdue blocking tasks can cascade delays to multiple dependent tasks
- Many at-risk tasks may indicate dependency planning issues
#Time Tracking
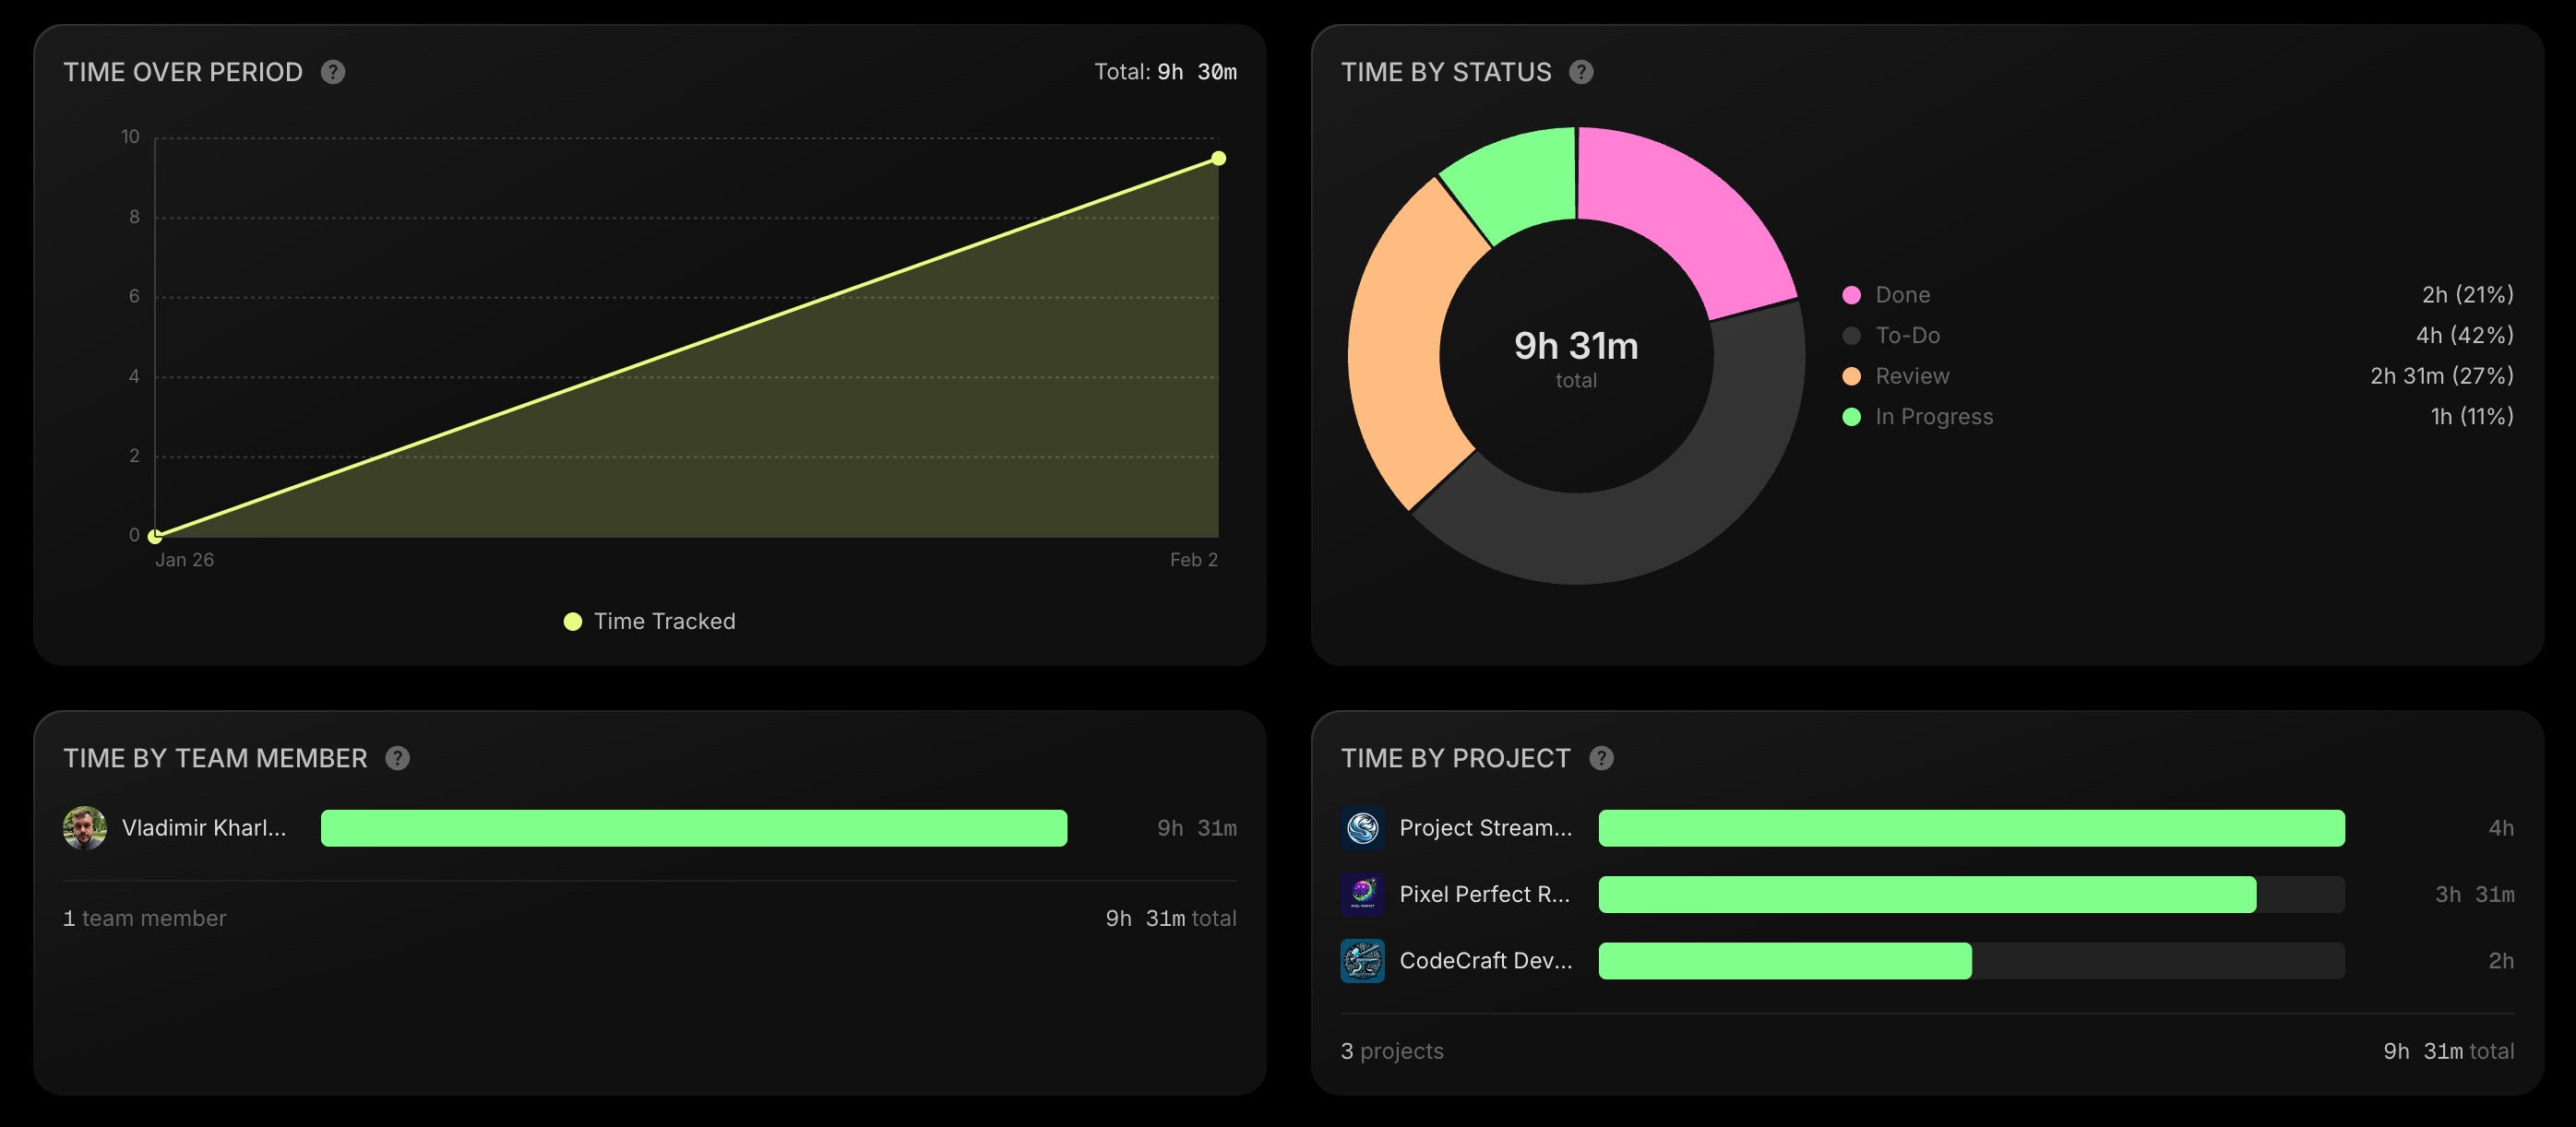
When Time Tracking is enabled for your board, four additional charts appear to help you analyze how time is being spent.
Time Over Period
A line chart showing cumulative time tracked over your selected date range. The total time for the period appears in the header. Use this to visualize time tracking trends and identify periods of high or low activity.
Time By Status
A donut chart breaking down tracked time by task status. The total time appears in the center, with each segment showing the hours and percentage for that status.
What to look for:
- High time in "Done" status indicates productive work being completed
- Disproportionate time in early statuses may indicate tasks getting stuck
- Compare with Status Distribution to see if time spent aligns with task counts
Time By Team Member
A horizontal bar chart showing total time tracked by each team member. The summary shows the number of active team members and total time for the period.
What to look for:
- Uneven distribution may reveal workload imbalances
- Compare with task assignments to ensure time tracking reflects actual work
- Identify top contributors for the selected period
Time By Project
A horizontal bar chart showing total time tracked per project. Each bar displays the project icon, name, and total hours. The summary shows the number of projects with tracked time and the total.
What to look for:
- Compare time investment across projects to ensure alignment with priorities
- Projects with high time but low completion may need attention
- Use alongside project filters to drill down into specific areas
#Monthly Awards
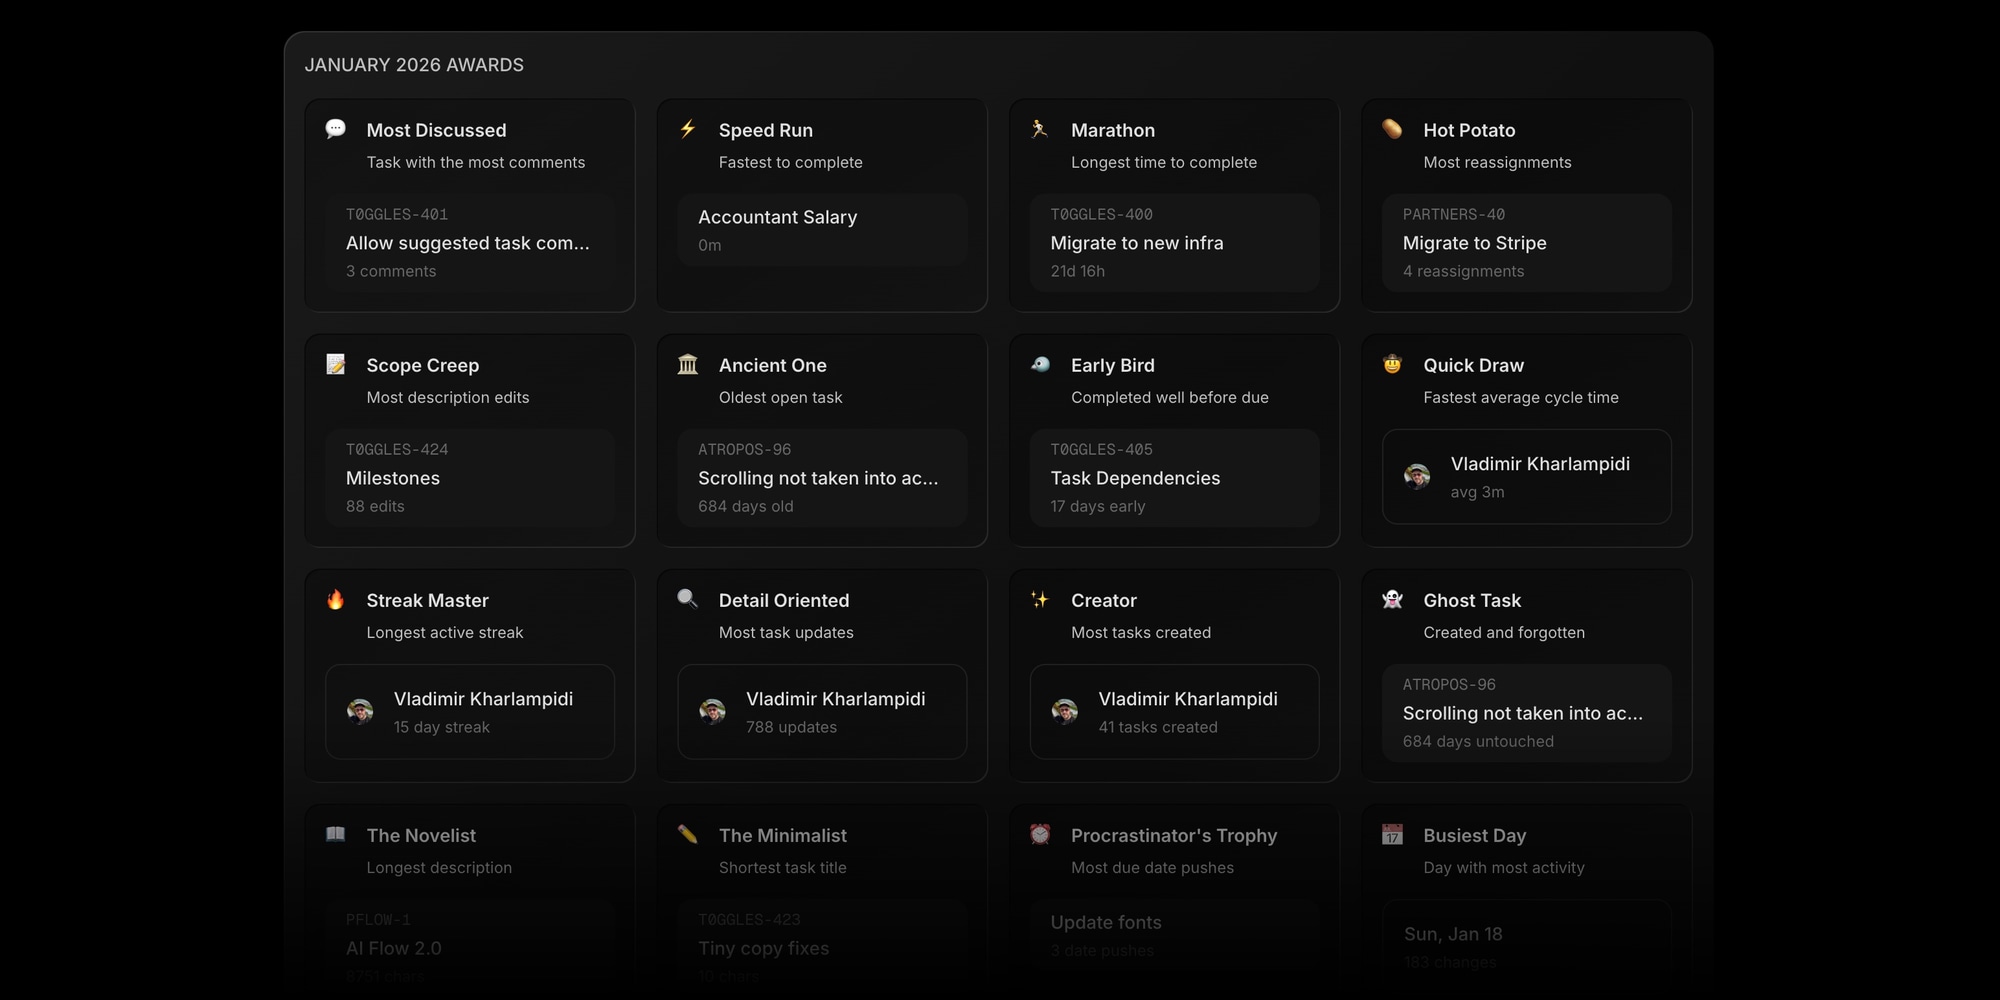
At the bottom of the Reports page, you'll find the Monthly Awards section - a fun way to recognize standout tasks and team members from the previous month. Awards are automatically calculated based on board activity and cached for performance.
The awards are grouped into several categories:
Task Awards highlight notable tasks from the month:
| Award | Description |
|---|---|
| Most Discussed | Task with the most comments (min 3) |
| Zombie Task | Task that keeps coming back from done (min 2) |
| Phoenix Task | Task risen from the archive |
| Speed Run | Fastest task to complete (shortest cycle time) |
| Marathon | Longest time to complete |
| Hot Potato | Task with the most reassignments (min 3) |
| Priority Ping-Pong | Task with the most priority changes (min 3) |
| Scope Creep | Task with the most description edits (min 5) |
| The Blocker | Task that blocks the most other tasks (min 2) |
| Ancient One | Oldest open task on the board |
| Early Bird | Completed well before its due date (min 3 days) |
| Collaboration Hub | Task with the most distinct editors (min 3) |
| Last Minute Hero | Completed just in time before the deadline |
Team Awards recognize individual contributions:
| Award | Description |
|---|---|
| MVP | Most tasks completed (min 5) |
| Chatterbox | Most comments written (min 10) |
| Quick Draw | Fastest average cycle time (min 3 tasks) |
| Streak Master | Longest consecutive active days (min 5) |
| Multitasker | Most concurrent in-progress tasks (min 3) |
| Detail Oriented | Most task updates (min 20) |
| Creator | Most tasks created (min 10) |
Fun Awards add a lighthearted touch:
| Award | Description |
|---|---|
| Ghost Task | Created and forgotten (no updates, 14+ days) |
| The Novelist | Longest task description |
| The Minimalist | Shortest completed task title (max 10 chars) |
| Procrastinator's Trophy | Most due date pushes (min 3) |
| The Comeback | Was overdue but still got completed |
Time Tracking Awards appear when time tracking is enabled:
| Award | Description |
|---|---|
| Time Champion | Most time logged (min 1h) |
| Deep Focus | Longest single session (min 30m) |
| Time Slicer | Most time entries (min 10) |
| Time Sink | Task with the most tracked time |
Milestone Awards and Activity Awards round out the collection with recognition for milestone completion and peak activity periods.
Each award card shows the winner - either a task (with its project key and title) or a team member (with their avatar). Click any task award to navigate directly to that task.
Awards are also included when you export reports to CSV or PDF.
#Export Options

Export your report data for sharing with stakeholders or archiving:
- CSV - Spreadsheet format containing all report data, suitable for further analysis in Excel or Google Sheets
- PDF - Formatted document ready for sharing or printing
Click the Export button in the report header and select your preferred format. The export includes all data based on your current filter settings.
#Data Caching
Report data is cached for approximately 5 minutes to ensure fast loading times. If you've made recent changes to tasks and don't see them reflected in the report, click the Refresh button (or press R) to fetch the latest data.
#Tips For Using Reports Effectively
- Track trends over time - Run the same report weekly or monthly to identify patterns. Is Lead Time improving? Is workload becoming more balanced?
- Use reports in retrospectives - The Activity Overview and Completion Rate metrics provide objective data for sprint retrospectives.
- Identify bottlenecks early - Check Status Distribution regularly. Tasks piling up in a specific status often indicate process or capacity issues.
- Monitor dependency health - For complex projects, keep an eye on blocking tasks and chain length. Long chains and overdue blockers are leading indicators of schedule risk.
- Track milestone progress - Use the Milestone Progress section to monitor key deliverables. Address at-risk milestones early before they become overdue.
- Share with stakeholders - Export PDF reports for status meetings. The visual charts communicate progress more effectively than raw numbers.
- Combine filters strategically - Use the Project filter to compare performance across different projects, or switch Date Type to see different perspectives on the same time period.
- Analyze time investment - Use Time Tracking reports to understand where team effort is going. Compare time by project and status to ensure resources align with priorities.